2020
Covid-19 tracker dashboard personal web application about the Coronavirus pandemic. I started to create this Covid-19 dashboard tracker at the beginning of the pandemic in France during the month of february 2020.
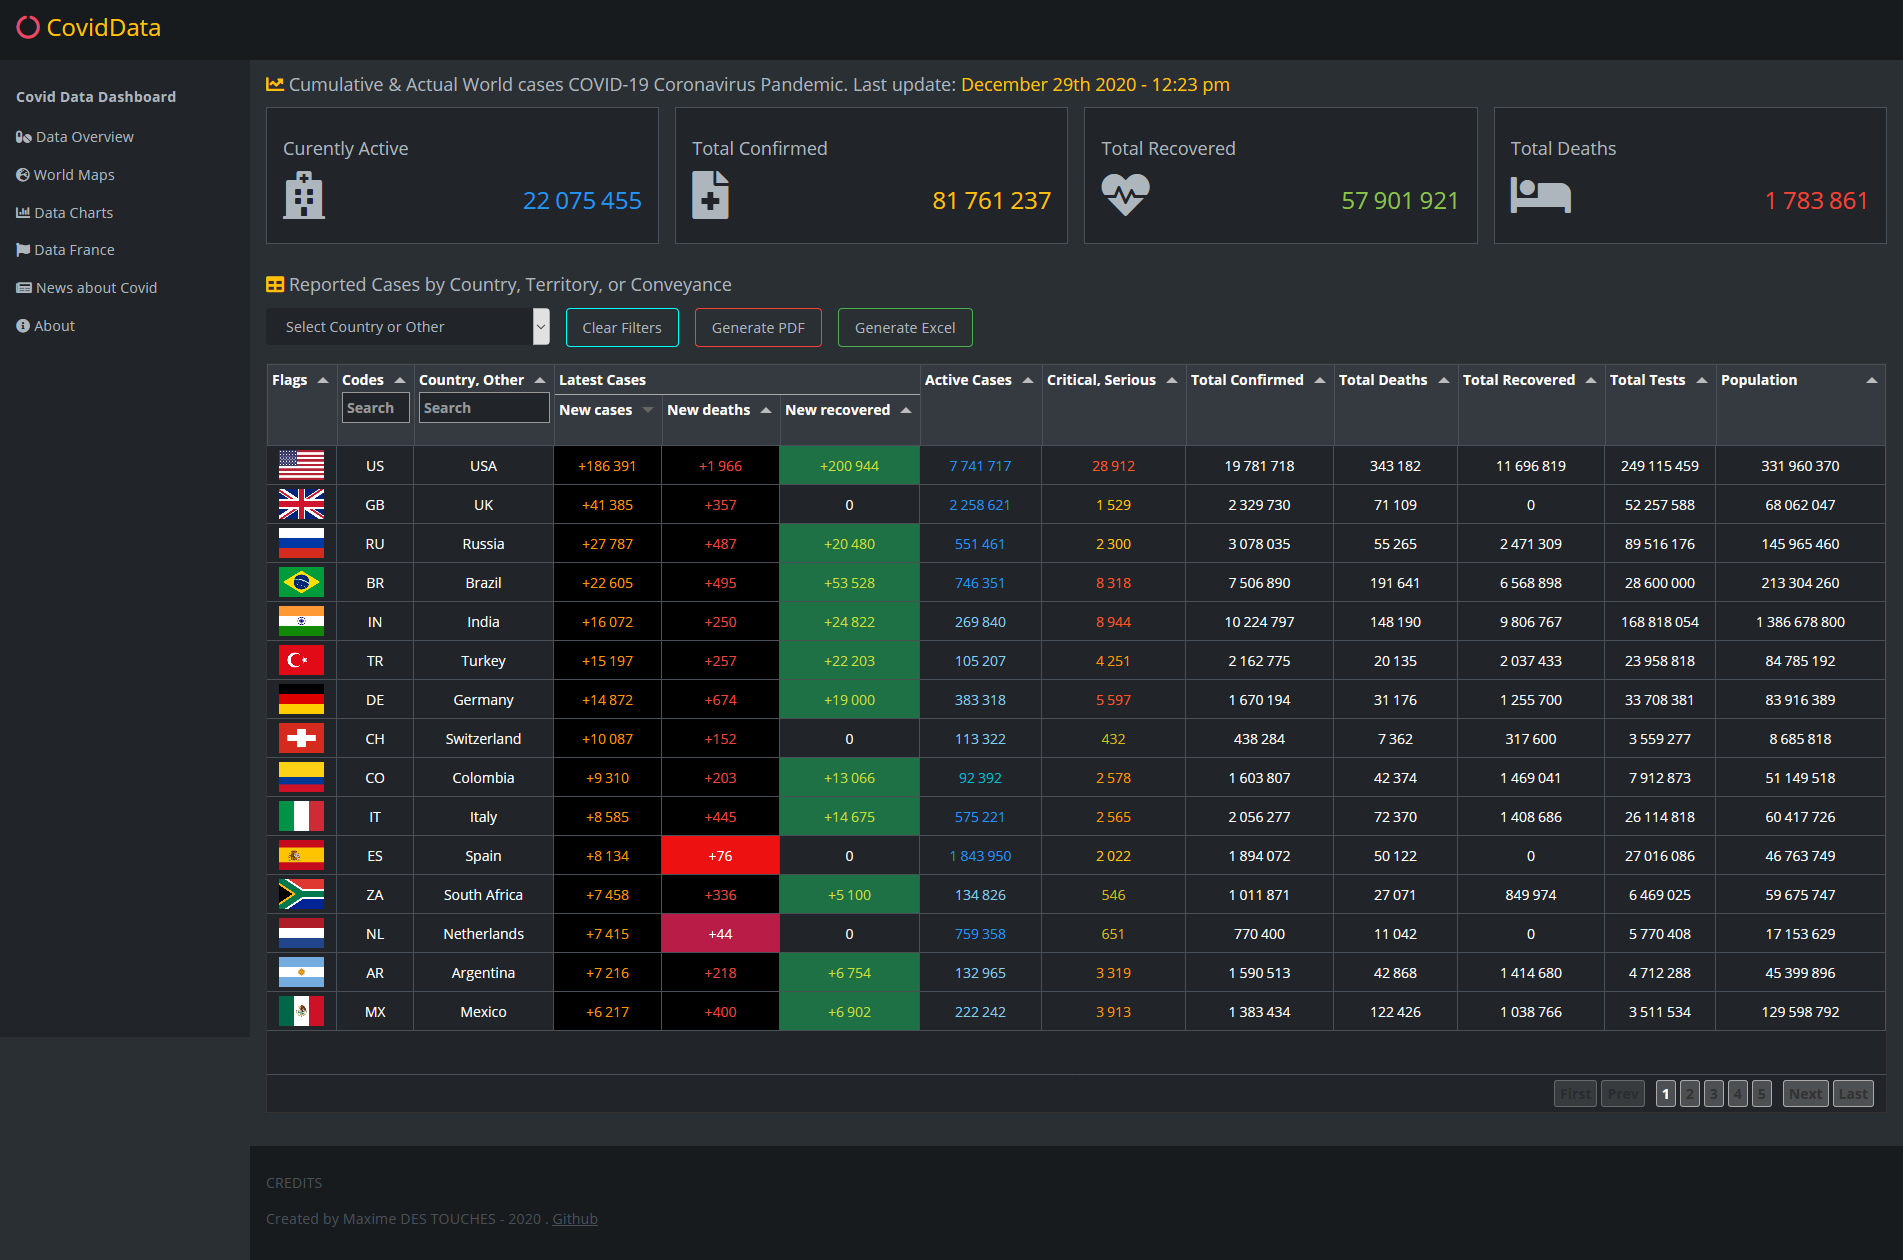
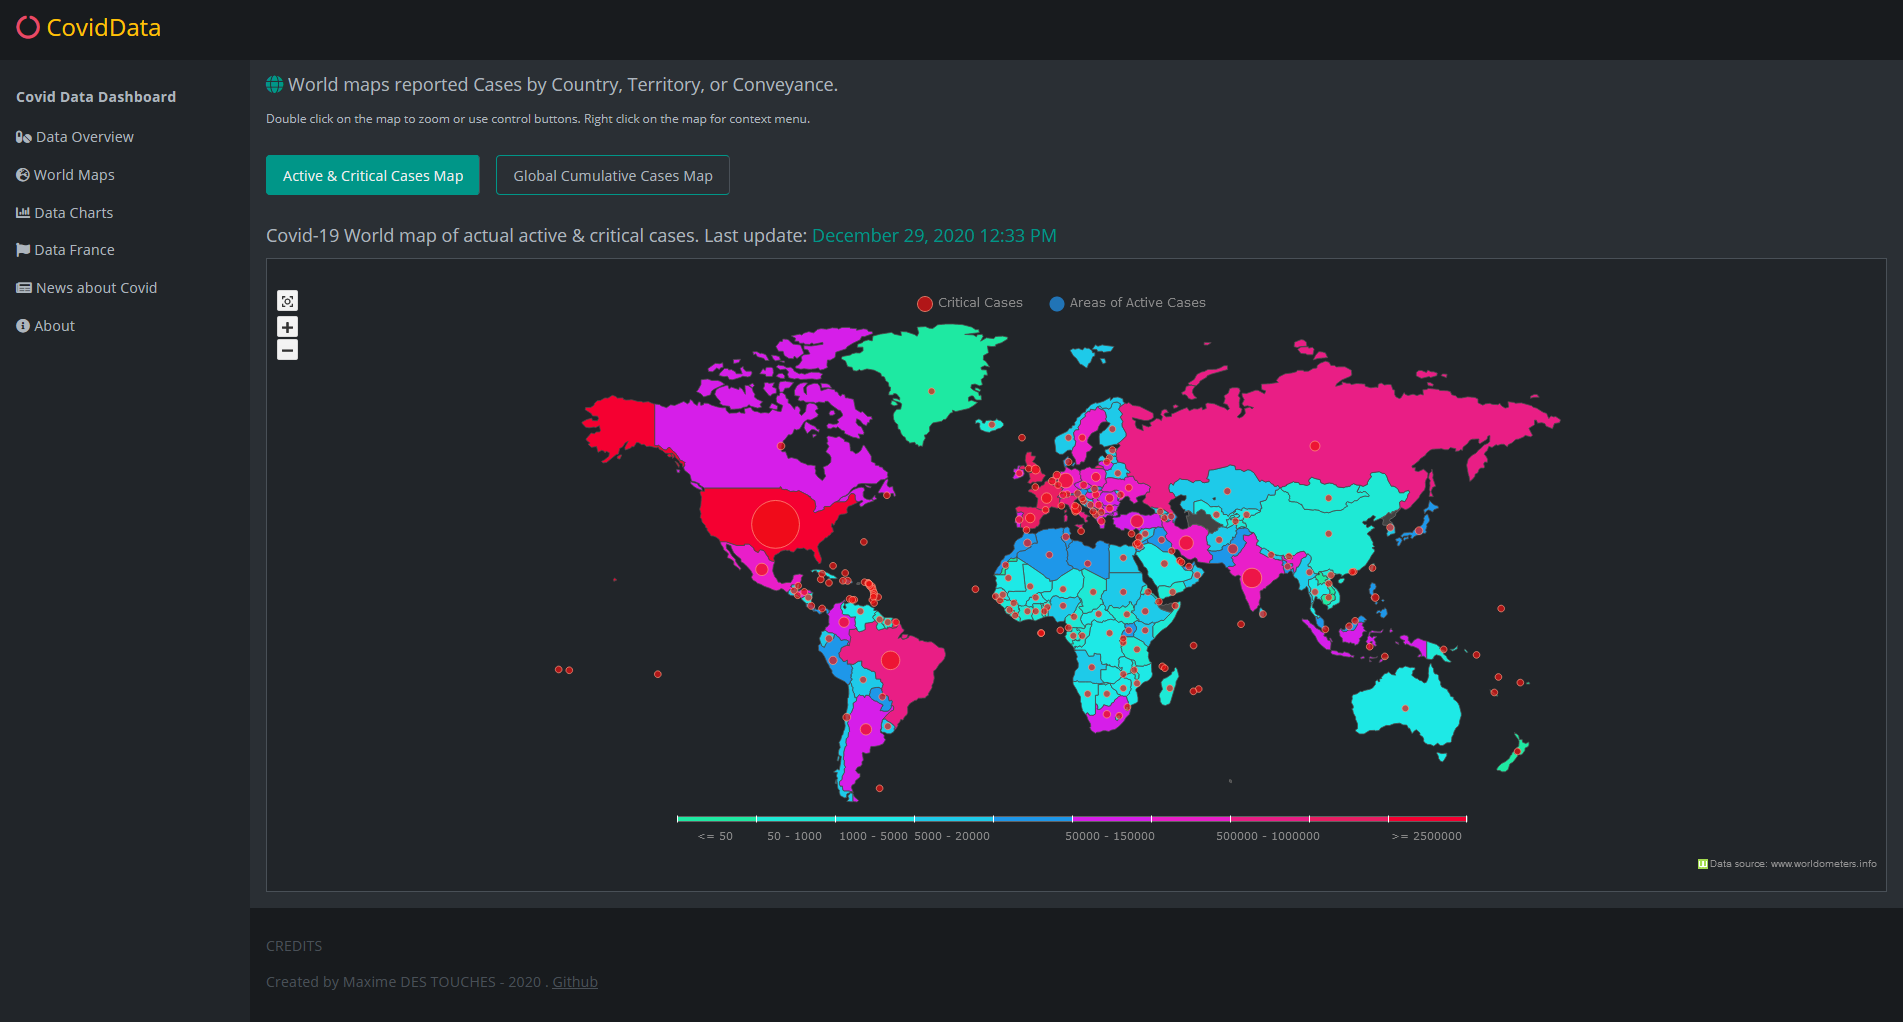
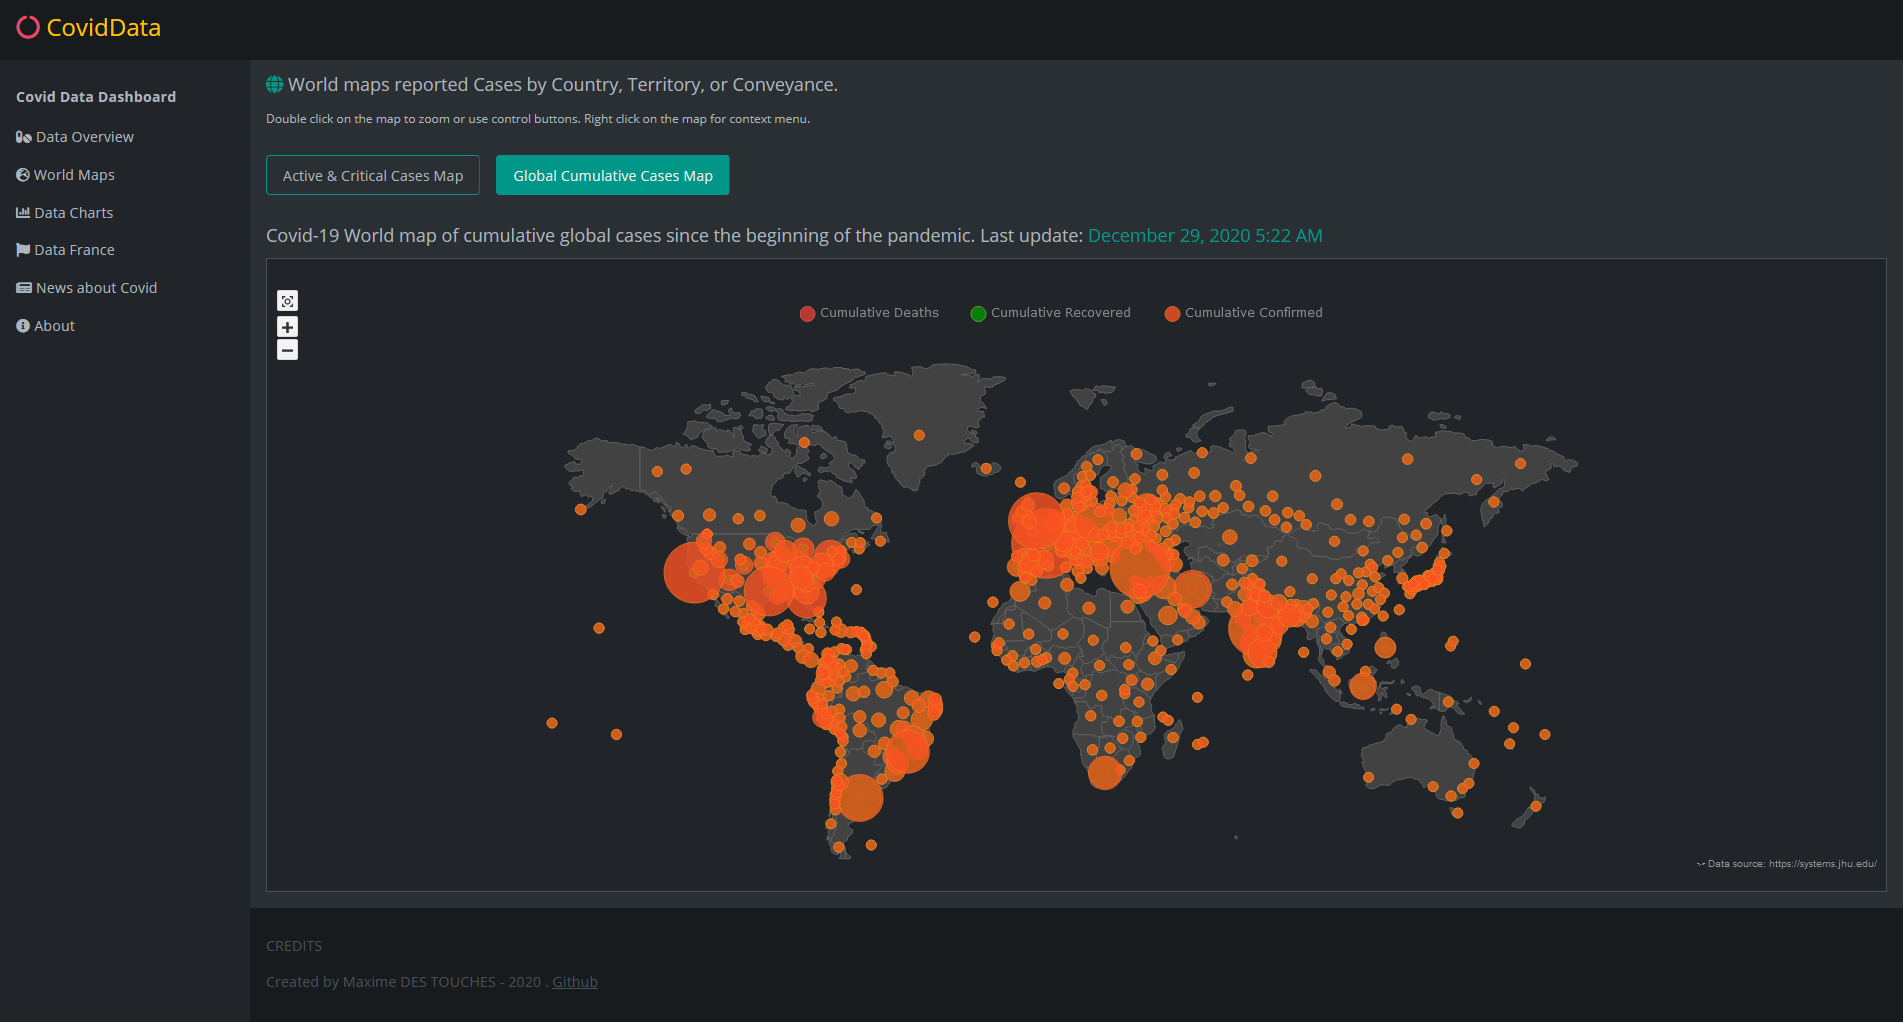
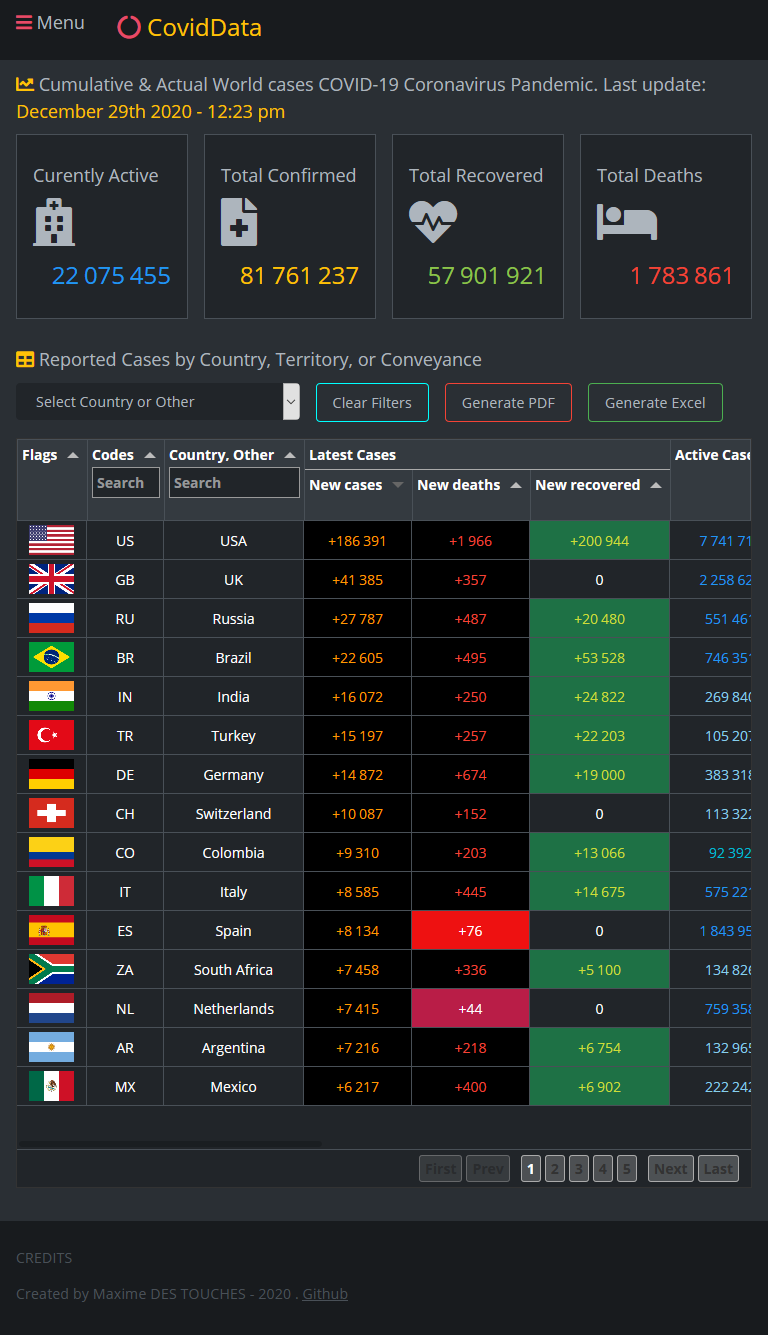
This covid dashboard let you display easily and quickly the global main informations around the world, per country, regions and counties with interactive maps and data tables.
Online Dashboard
elreviae.github.io/coviddata/
Tools
Microsoft Visual Studio Code / HTML5 / CSS / JavaScript / JQuery / Different JS Librairies (maps, tables, charts)
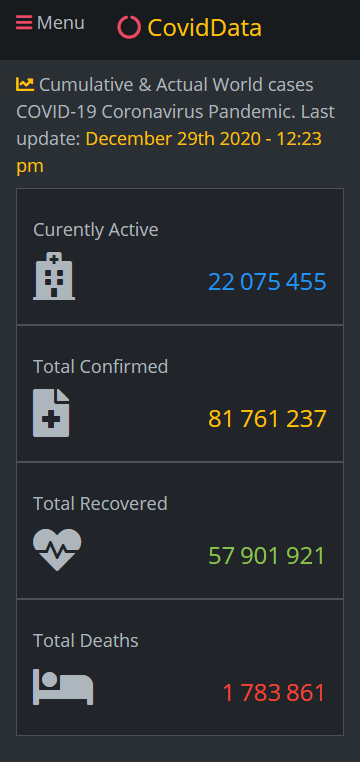
Home page CovidData Dashboard
World maps page Active & Critical cases CovidData Dashboard
World maps page global cases CovidData Dashboard
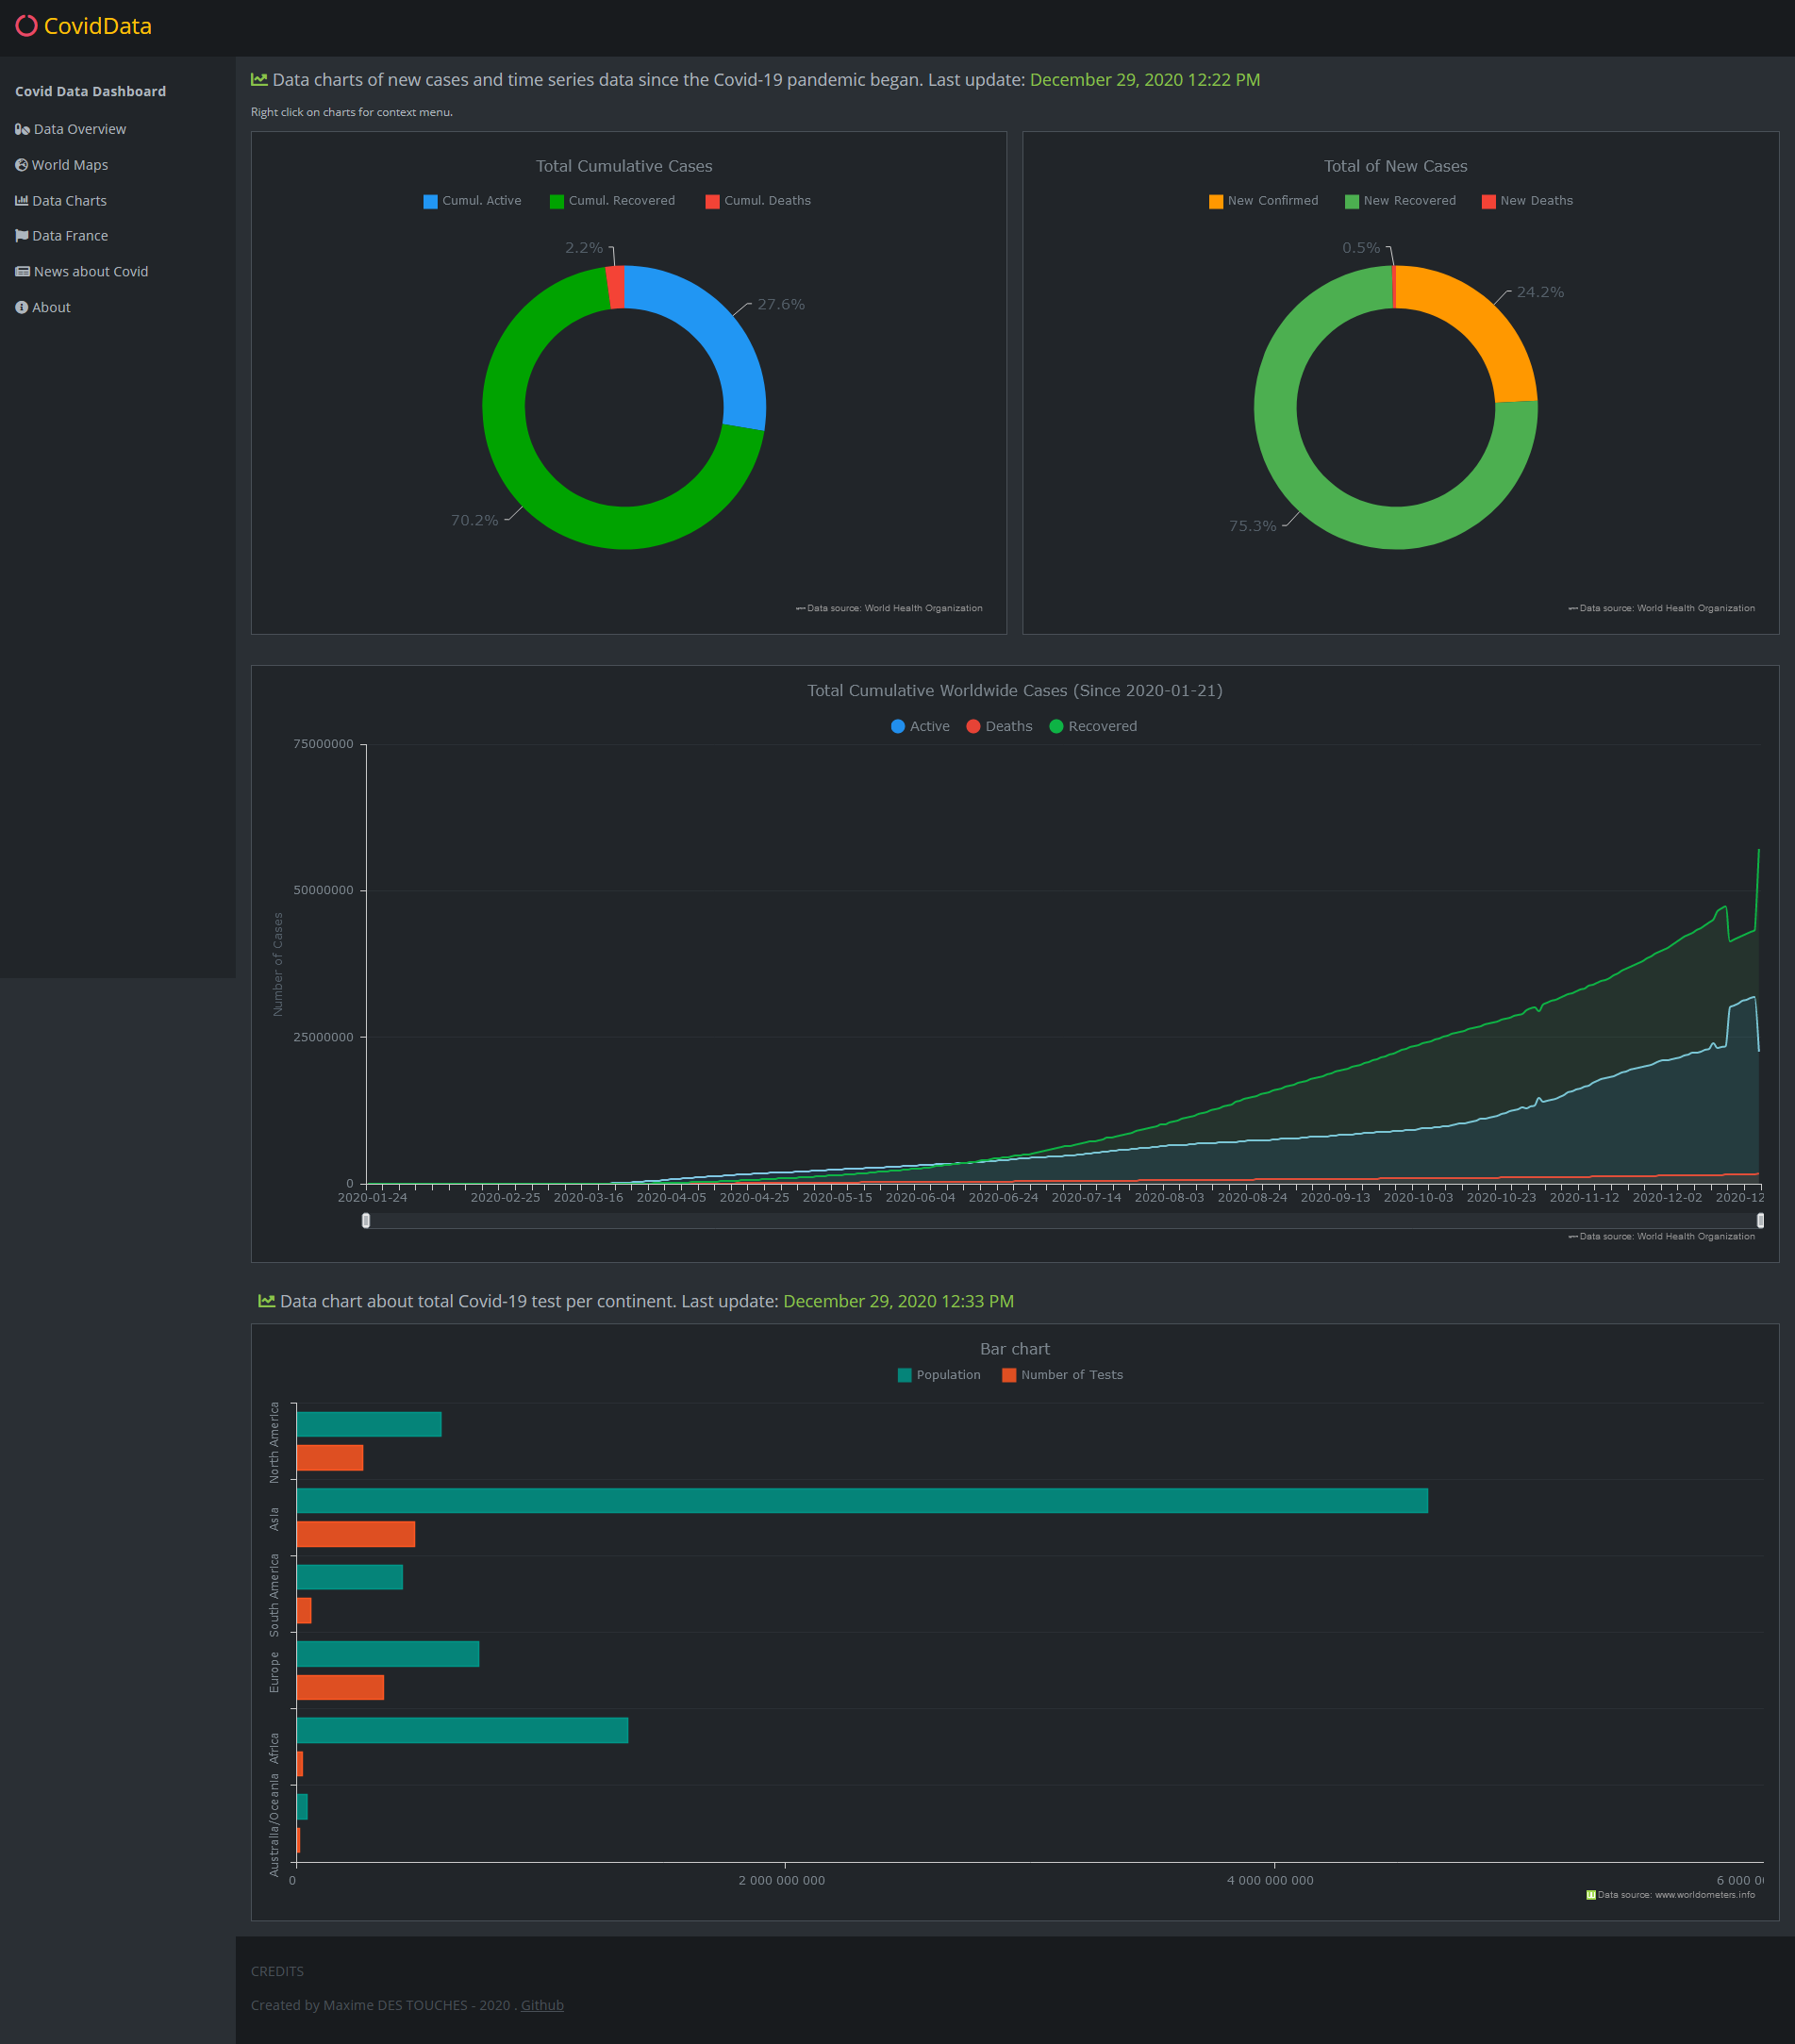
Data charts page CovidData Dashboard
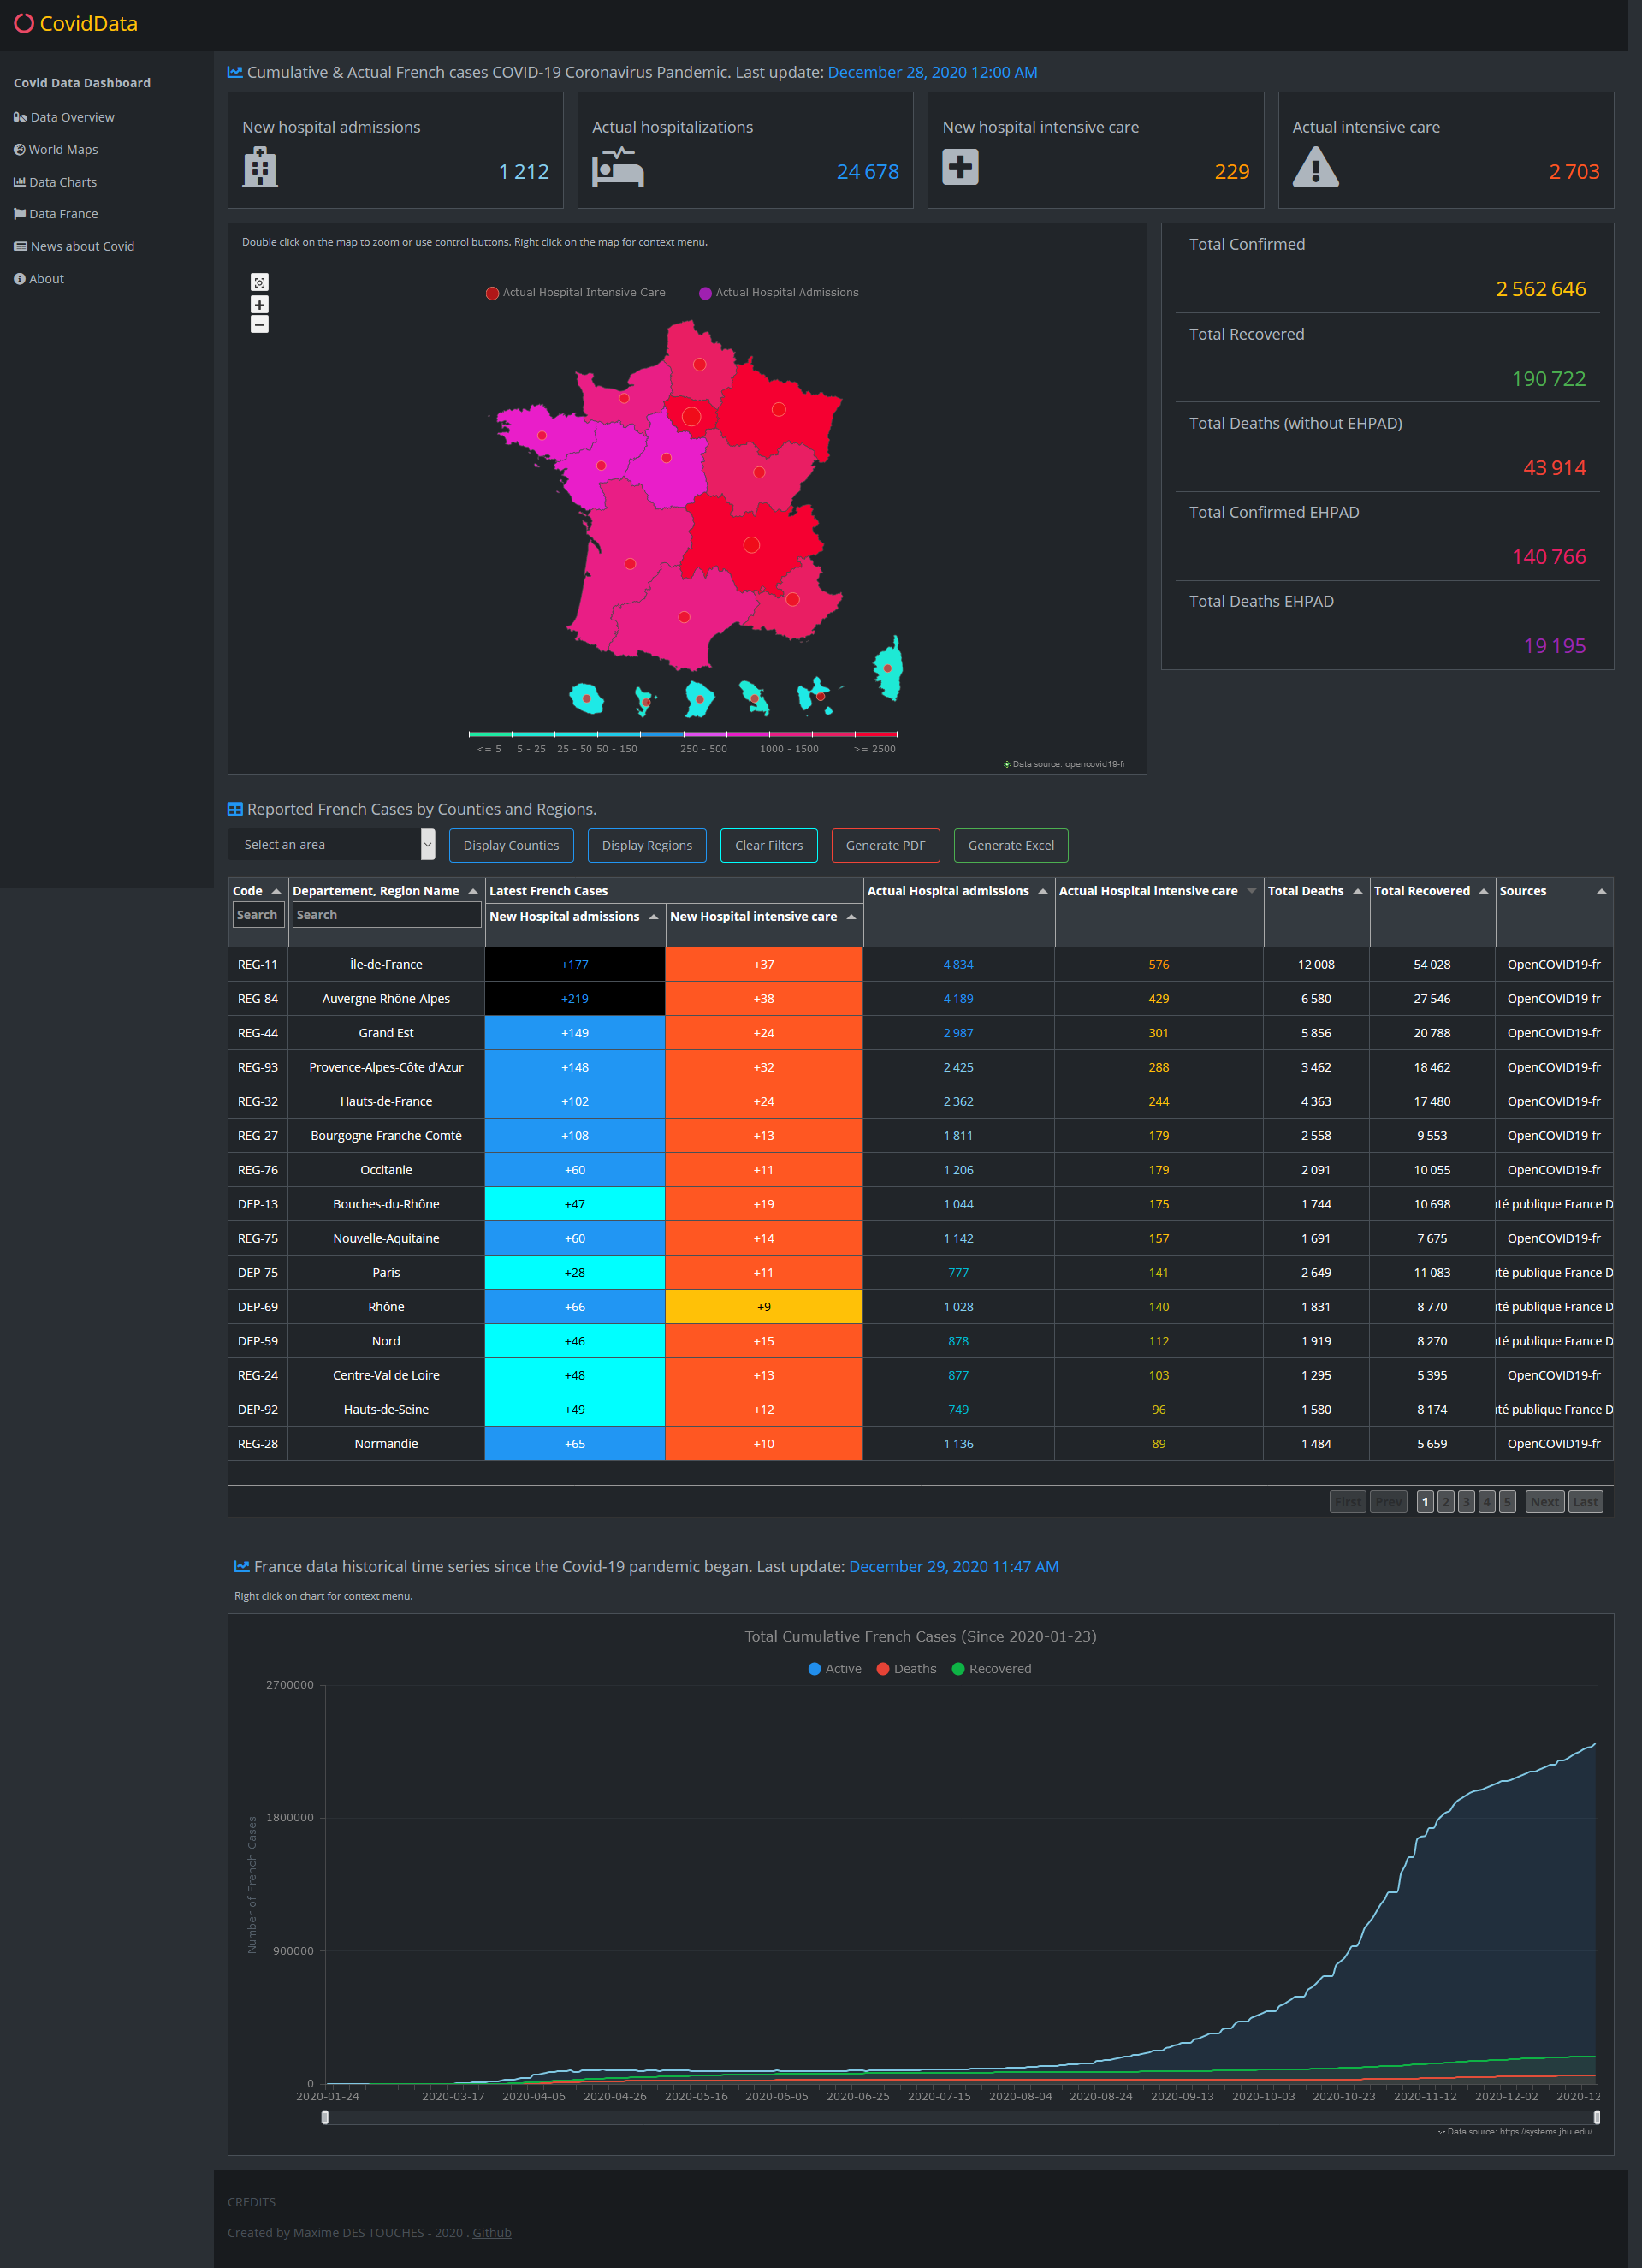
Data France page CovidData Dashboard
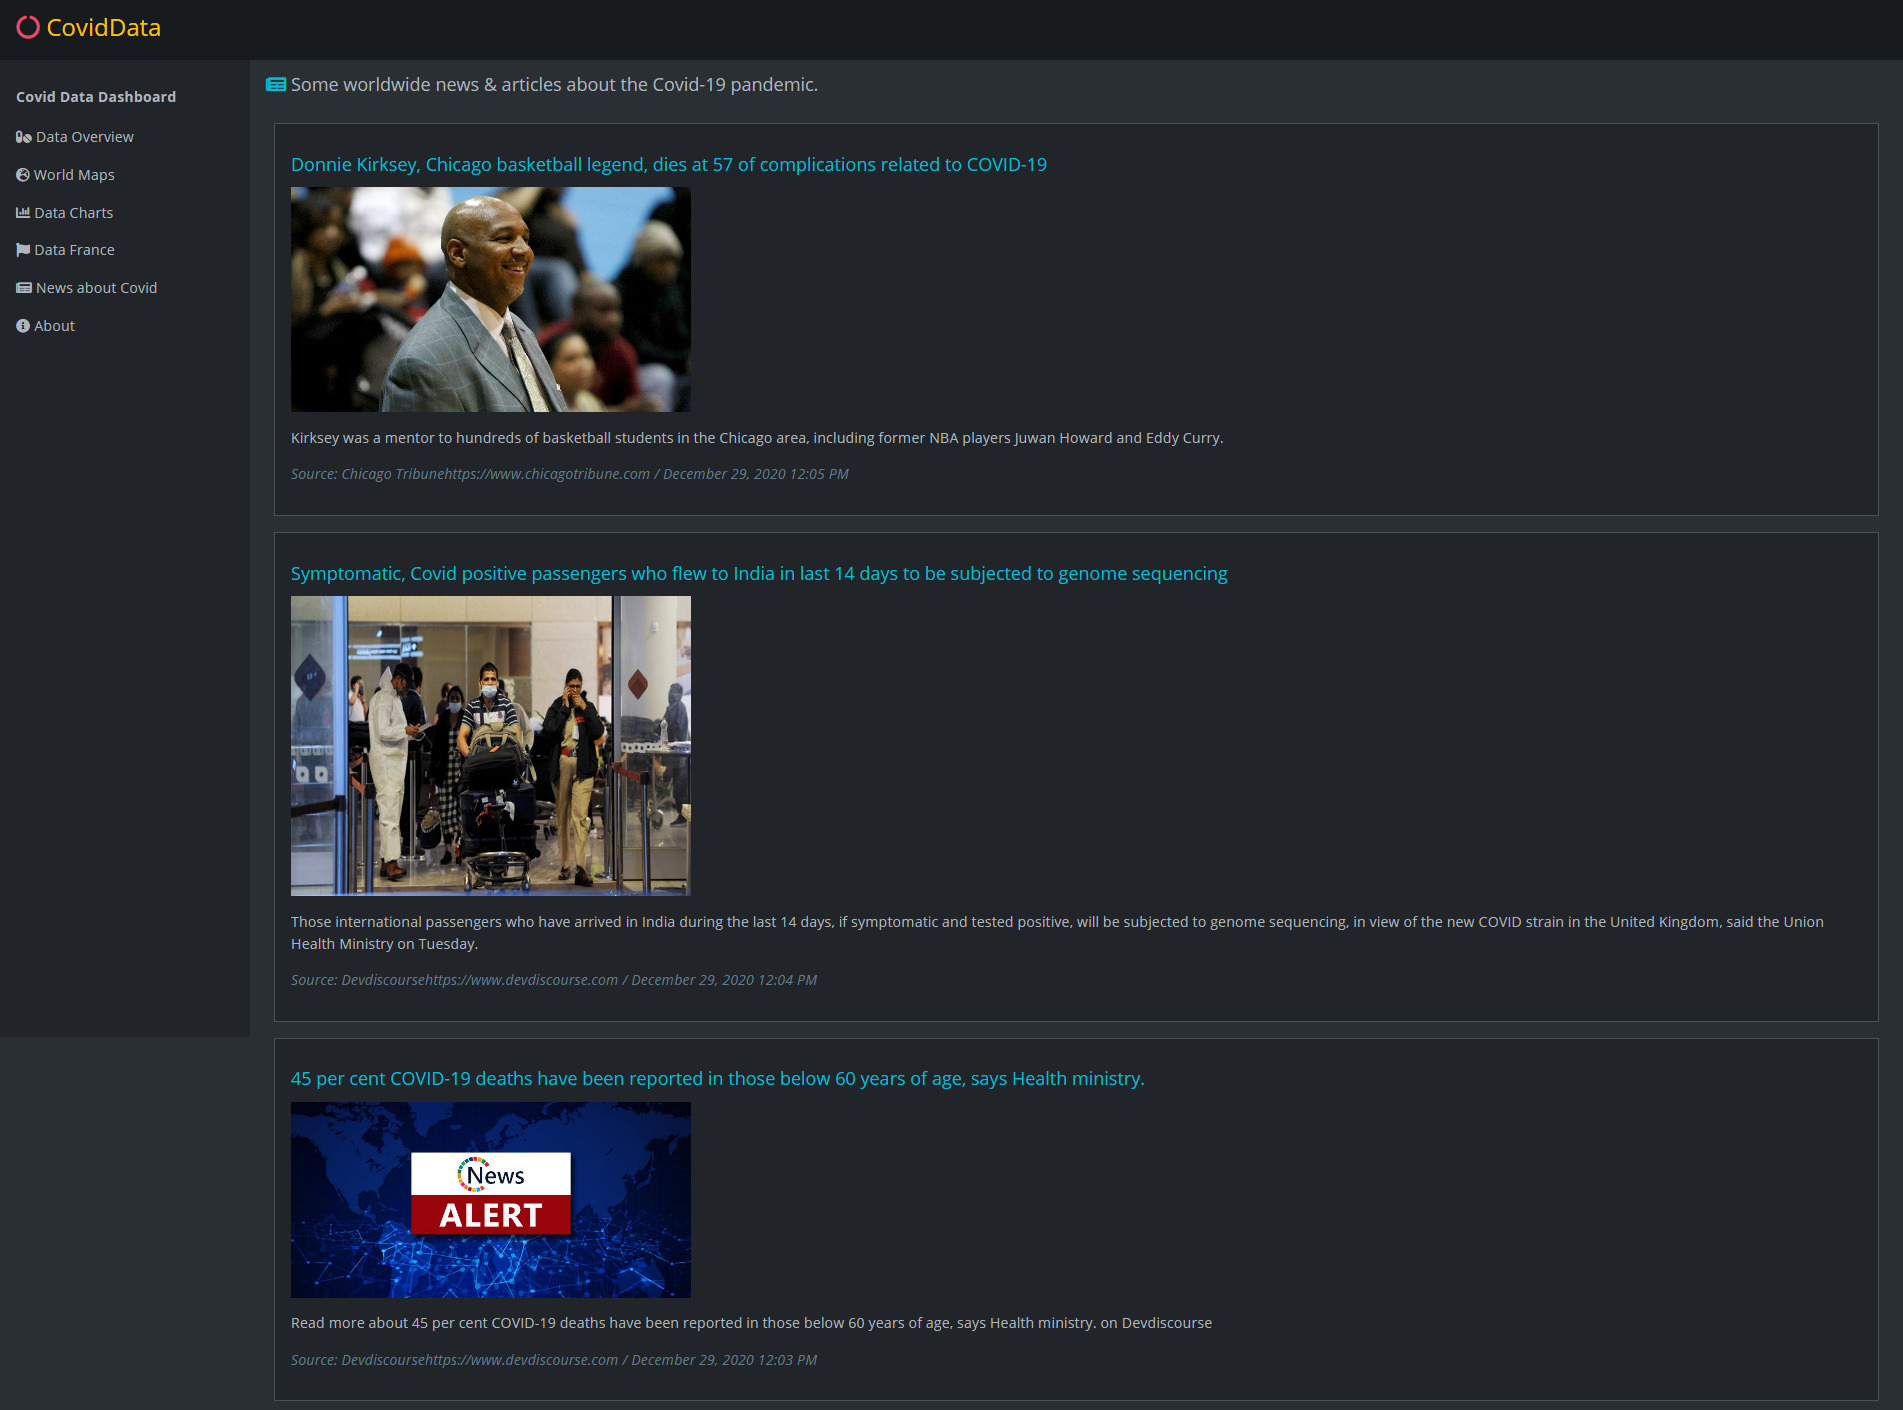
News page CovidData Dashboard
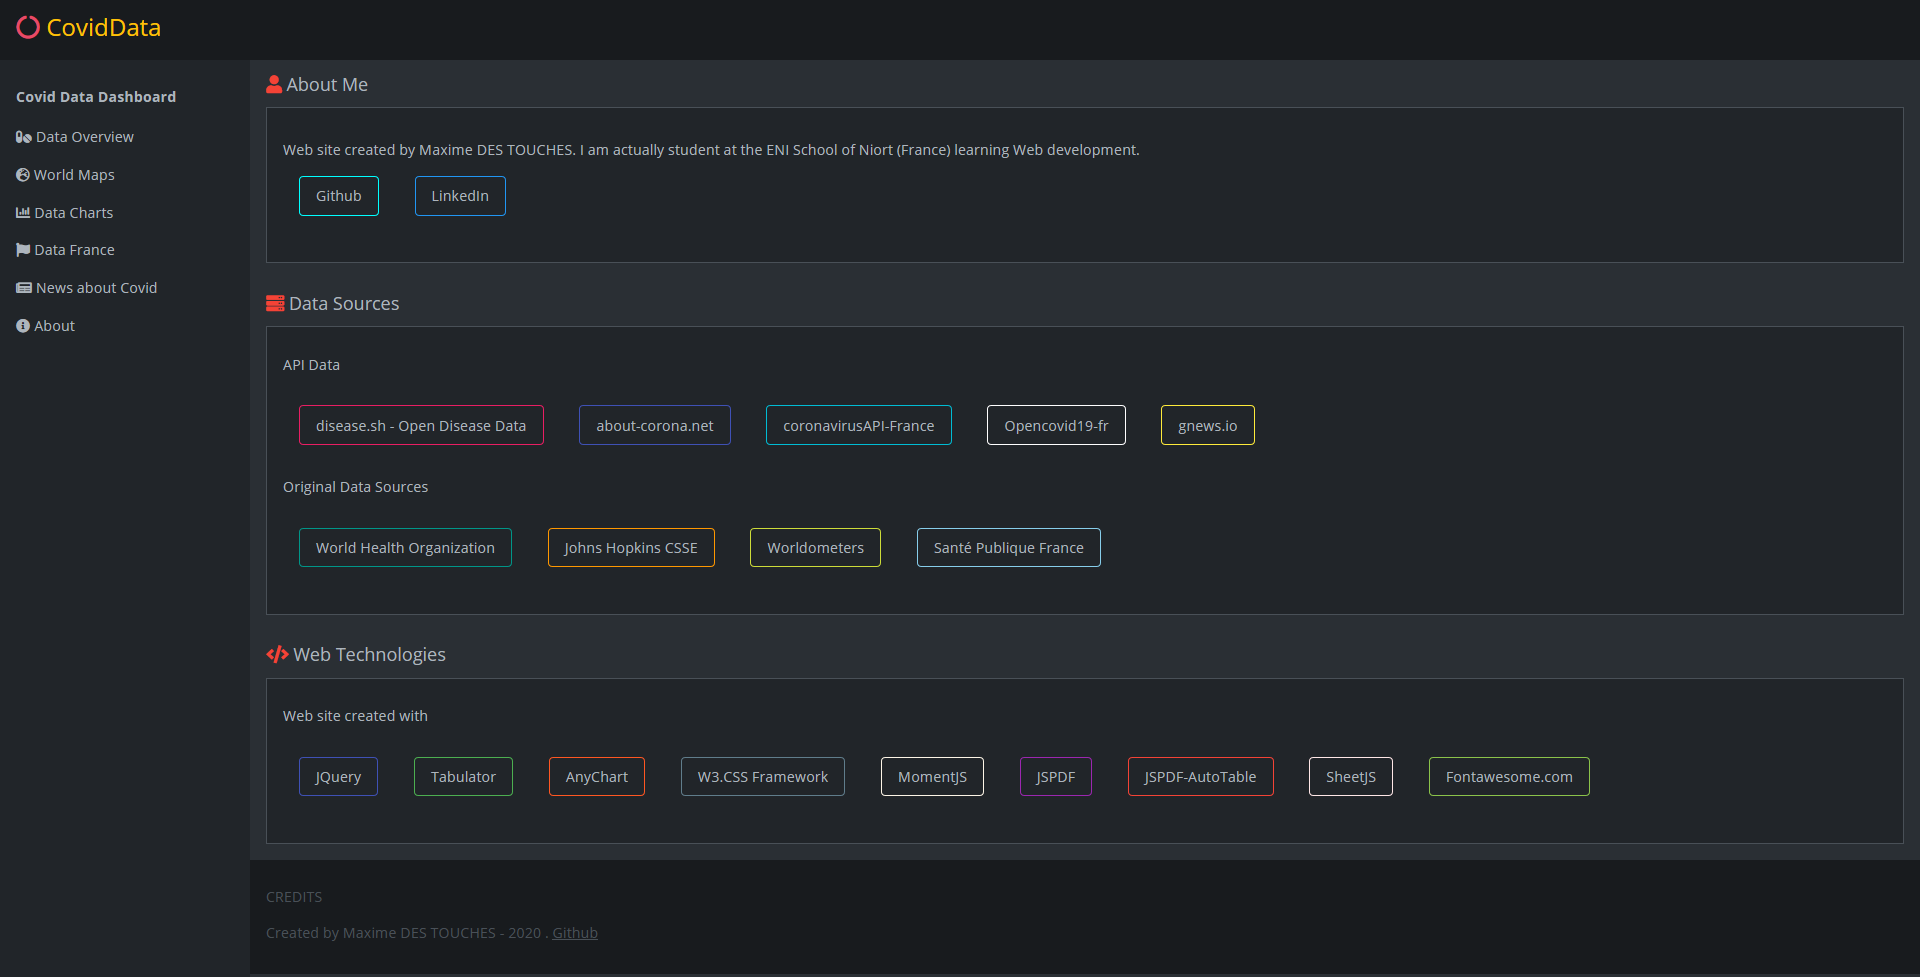
About page CovidData Dashboard
